




LoadBear icon

LoadBear

A desktop app that shows you what is overloading your machine, not merely that it is busy.

Version 0.1.0 · 2.1 MB · Windows 10 or 11, x86-64 · Apache-2.0
SHA-256 4d4978364d54d52bf6990cbd760e54b7e47bb58056e62b10d27e9f14599cee74

Docker containers, dev servers, builds, IDE indexers, browsers and local models all run at once, and the first sign of trouble is usually that everything feels slow. By then you are guessing at the cause. LoadBear measures how long work spends waiting, names the process group responsible, and judges it against limits the vendor published.

LoadBear
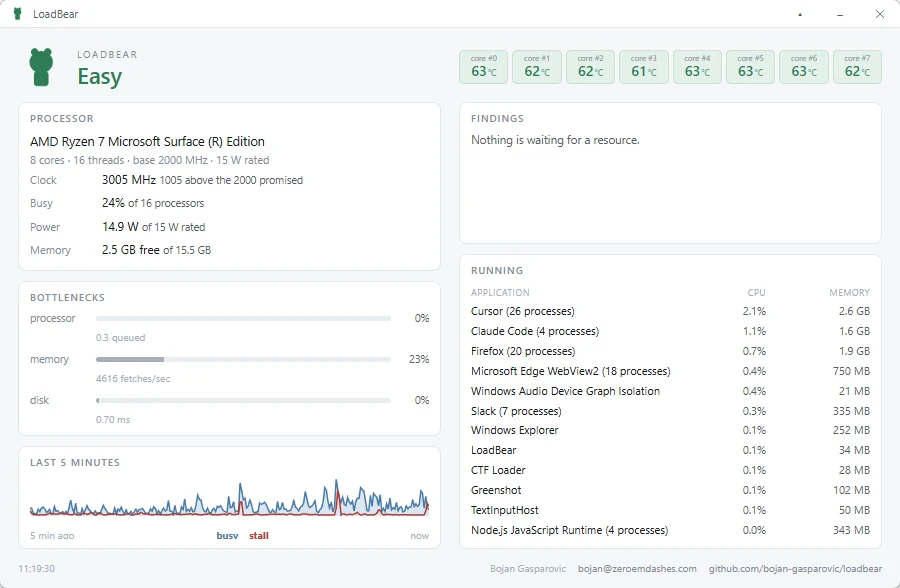
The full LoadBear panel with the verdict, processor detail, bottleneck bars, a five minute trace and a table of running applications 01 · Expanded

The full panel.

Where you go once something feels wrong. A single word at the top says how hard the machine is working right now. Under it: what the processor is doing, how long work waits on the processor, memory and disk, the last five minutes as a trace, and the applications responsible.

LoadBear folded to a strip showing the five minute trace beside eight labelled core temperatures 02 · Collapsed

A strip on top of your work.

The same reading with the explanation taken away. You keep the five minute trace and the eight core temperatures. It sits on top of your work without covering it, which is where it spends most of its time.

The strip in the braced state: an amber bear beside a busy trace 03 · Braced

The bear is the verdict.

LoadBear grades the machine as easy, braced or strained, and the bear shows it in its posture. Easy stands upright with a neck. Braced sinks into its shoulders.

The strip in the strained state: a red bear beside a trace where stall stays high 04 · Strained

No neck left at all.

Colour follows the posture, green to amber to red, but the shape alone is enough. That keeps it readable at sixteen pixels in the tray.

LoadBear at taskbar size: the bear, the trace, and eight unlabelled core temperatures 05 · Taskbar

Small enough for the taskbar.

It sits above the taskbar without taking a row of screen from anything else. The labels come off, so position in the grid tells you which core a number belongs to. A chevron brings the full panel back.

What it does
Stall, not usageMeasures waiting, not busyness

100% CPU with a short run queue is a machine working well. 40% CPU while paging to disk is a machine dying, and most tools make that look fine. LoadBear reports the time work spent waiting on the processor, memory and disk.

AttributionNames what is responsible

Process groups carry the name a person would use rather than the executable, and Docker containers are resolved through the engine API.

AuthorityJudges against published limits

Sustained clock against the guaranteed base clock. Package power against the rated TDP band. Headroom to the junction temperature limit. Every finding carries the authority its threshold rests on, so you can check it.

RestraintWaits before it panics

A condition has to hold before the state escalates, so a two second spike does not turn the bear red. It is a window you look at. It sends no notifications.

Temperature and power

Everything works out of the box except per-core temperature and package power, which need ring-0 access. LoadBear ships no driver of its own. Press Enable temperature and it downloads PawnIO from its official release URL, checks the Authenticode signature, and only then runs it. PawnIO is signed, HVCI compatible, and runs sandboxed bytecode rather than exposing raw ring-0 primitives.

WinRing0, the traditional answer, sits on the Windows vulnerable driver blocklist and was never an option here. Elevation is asked for once. Decline it and everything else still works, with temperature and power reported as unavailable rather than guessed at.